
Leaflet SVG Markers: Align the Tip with iconAnchor
Position custom SVG markers in Leaflet by mapping the visible tip to iconAnchor. Account for viewBox padding, aspect-ratio fitting, and changes in icon size.
On this page
For a Leaflet custom SVG marker, set iconSize to the displayed image dimensions and iconAnchor to the visible tip's pixel position within that image. Measure from the image's top-left corner. Transparent SVG margins count toward those dimensions, so half the width and the full height can miss an asymmetric or padded pin.
This guide uses an original pin whose tip sits to the right of its body's center. We compare two source frames at two icon sizes in a tile-free browser map. If you already have clean SVG artwork, use it directly; anchor placement does not require vectorization.
Separate the artwork, image box, and map point
Three coordinate systems meet here. The SVG path describes the artwork in source units. iconSize establishes its displayed image box in pixels. Leaflet positions the point inside that box specified by iconAnchor at the marker's geographic location. The Icon reference defines these options and the top-left anchor origin.
A conventional pin may reach the middle of the bottom edge, but your artwork can end elsewhere. Leaflet's documented default is a centered anchor when a size is specified. The bottom-center values in our experiment are an explicit assumption we test, not that default.
The official custom-icon tutorial shows how to pass an L.icon instance to a marker. The extra work for imported artwork is finding the point inside its image that should touch the map coordinate.
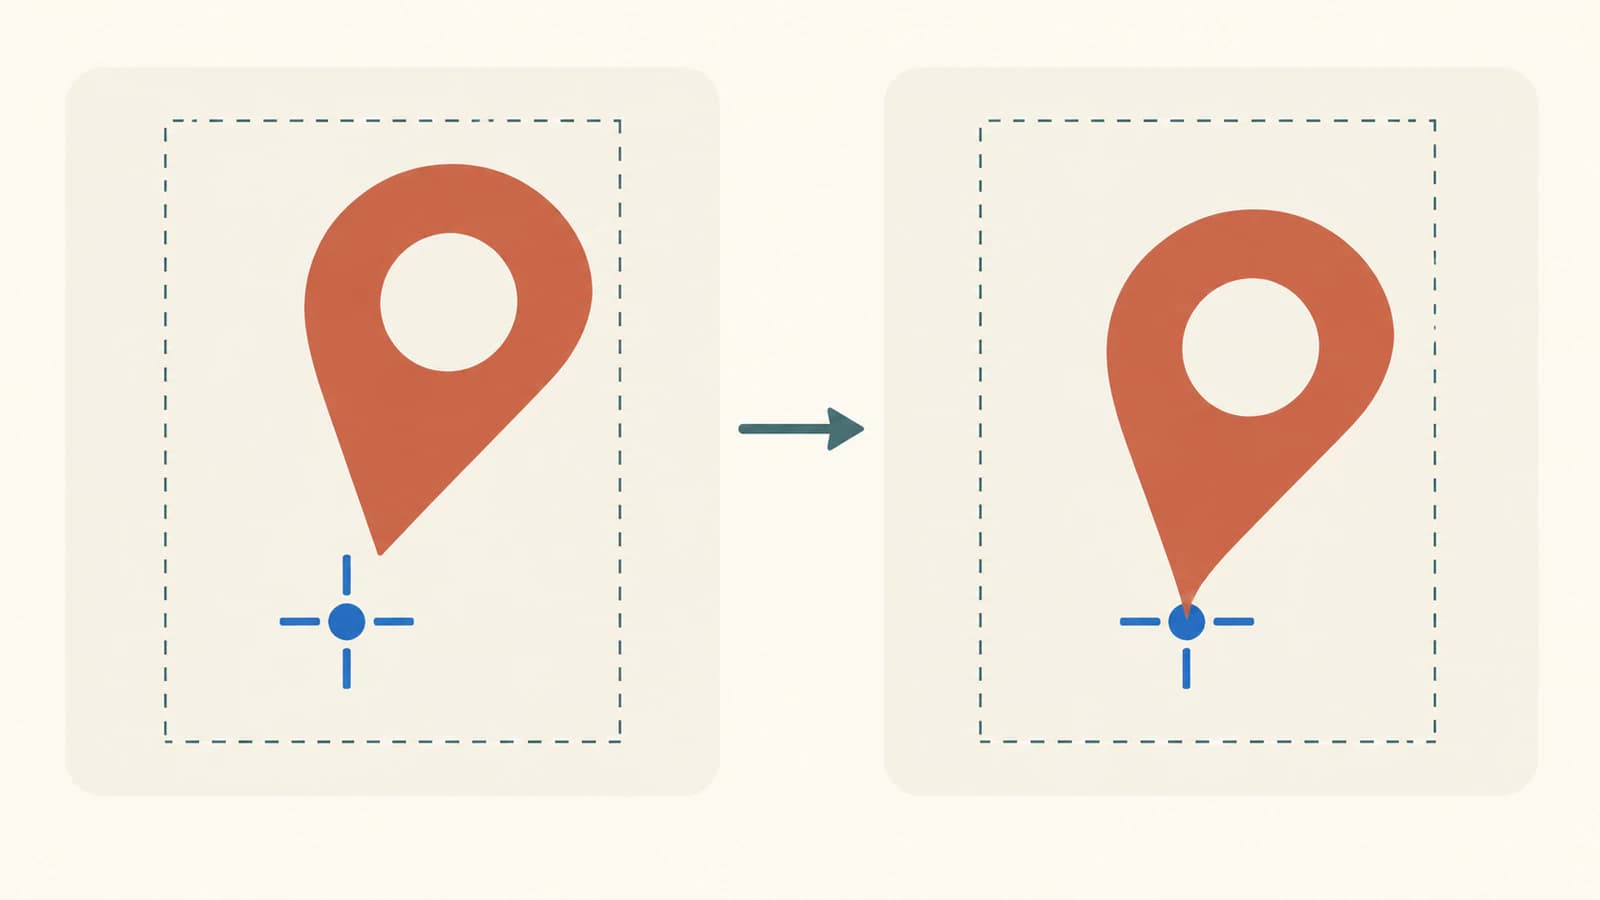
Map the source tip into icon pixels
Our pin's tip is at source coordinate (40, 80). Its tight frame is viewBox="0 0 60 80". The padded version changes only that frame to viewBox="-20 -10 100 120"; both files retain the same path and transparent opening.
The viewBox reference describes this source rectangle. Empty space inside it travels with the artwork. Our SVG bounding-box guide explains why a canvas and a painted shape can have different bounds.
Both versions explicitly use preserveAspectRatio="xMidYMid meet". This fits the frame uniformly inside the viewport and centers any leftover space. See MDN's preserveAspectRatio reference for those settings.
For this fitting mode, let W and H be the icon dimensions, (minX, minY, vbW, vbH) the viewBox, and (tipX, tipY) the source tip:
s = min(W / vbW, H / vbH)
offsetX = (W - vbW * s) / 2
offsetY = (H - vbH * s) / 2
anchorX = (tipX - minX) * s + offsetX
anchorY = (tipY - minY) * s + offsetY
For the padded 60×80 icon, s is 0.6. The 100×120 source frame occupies 60×72 pixels, leaving four pixels above and below. The tip becomes [36, 58], including that vertical offset. Simply taking a fraction of each dimension separately would miss the uniform fitting step.
| Source frame | Icon size | Computed tip anchor |
|---|---|---|
| Tight, 0 0 60 80 | 60×80 | [40, 80] |
| Tight, 0 0 60 80 | 90×120 | [60, 120] |
| Padded, -20 -10 100 120 | 60×80 | [36, 58] |
| Padded, -20 -10 100 120 | 90×120 | [54, 87] |
These calculations apply to our untransformed image and explicit centered meet setting. A different alignment, slice, or none needs its matching coordinate mapping. Our aspect-ratio guide covers those choices. Extra CSS transforms on the marker image also need separate inspection.
Check the placement in a tile-free map
We used Leaflet 1.9.4, the stable release identified on the official download page. The experiment loads its pinned JavaScript and CSS locally and adds no tile layer. Each map projects coordinate [0, 0] to a blue crosshair; it displays one SVG image beside that reference point.
The source inspection found one identical compound path and no embedded raster image in each SVG. Browser image dimensions were 60×80 and 90×120 pixels as requested. Using each image's observed rectangle, we compared the mapped tip position with the projected geographic point:
| Source | Icon size | Error with assumed bottom-center anchor | Error with computed tip anchor |
|---|---|---|---|
| Tight | 60×80 | 10 px right | 0 px |
| Tight | 90×120 | 15 px right | 0 px |
| Padded | 60×80 | 6 px right, 22 px up | 0 px |
| Padded | 90×120 | 9 px right, 33 px up | 0 px |
The crosshair also visibly met the corrected pin tips. These are observations of this authored fixture in one Chrome browser, not a guarantee for every SVG, browser, or map integration. The padded pin remains smaller inside the same image box after its anchor is corrected. Placement and artwork size are separate decisions.
Copy a working marker starter
Save this complete HTML as marker.html and serve it from a local web server. It loads the pinned Leaflet files from the CDN linked by Leaflet's download page. The SVG is encoded into an image URL, so the example needs no icon file or tile service. Internet access is needed for those two library files.
<!doctype html>
<html lang="en">
<meta charset="utf-8">
<title>Leaflet SVG tip anchor</title>
<link rel="stylesheet"
      href="https://unpkg.com/leaflet@1.9.4/dist/leaflet.css">
<style>
  #map { width: 360px; height: 300px; background: #edf3ef; }
  .cross { position: absolute; z-index: 1000; pointer-events: none;
    width: 24px; height: 24px; transform: translate(-50%, -50%); }
  .cross::before, .cross::after { content: ""; position: absolute;
    background: #006cbe; }
  .cross::before { top: 12px; width: 24px; height: 1px; }
  .cross::after { left: 12px; width: 1px; height: 24px; }
</style>
<div id="map"></div>
<pre id="status">Loading marker…</pre>
<script src="https://unpkg.com/leaflet@1.9.4/dist/leaflet.js"></script>
<script>
const svg = `<svg xmlns="http://www.w3.org/2000/svg" width="60" height="80" viewBox="-20 -10 100 120" preserveAspectRatio="xMidYMid meet"><path fill="#bf593c" fill-rule="evenodd" d="M30 0 C46 0 60 12 60 28 C60 46 46 54 40 80 C30 62 0 46 0 28 C0 12 14 0 30 0 Z M40 26 A10 10 0 1 0 20 26 A10 10 0 1 0 40 26 Z"/></svg>`;
const size = [60, 80];
const viewBox = [-20, -10, 100, 120];
const sourceTip = [40, 80];
const scale = Math.min(size[0] / viewBox[2], size[1] / viewBox[3]);
const anchor = [
  (sourceTip[0] - viewBox[0]) * scale
    + (size[0] - viewBox[2] * scale) / 2,
  (sourceTip[1] - viewBox[1]) * scale
    + (size[1] - viewBox[3] * scale) / 2
];
const map = L.map("map", {
  zoomControl: false, attributionControl: false,
  dragging: false, scrollWheelZoom: false, doubleClickZoom: false,
  boxZoom: false, keyboard: false, touchZoom: false
}).setView([0, 0], 2);
const position = [0, 0];
const icon = L.icon({
  iconUrl: "data:image/svg+xml;charset=utf-8," + encodeURIComponent(svg),
  iconSize: size,
  iconAnchor: anchor
});
const marker = L.marker(position, { icon }).addTo(map);
const container = document.querySelector("#map");
const cross = document.createElement("span");
cross.className = "cross";
container.append(cross);
const point = map.latLngToContainerPoint(position);
cross.style.left = point.x + "px";
cross.style.top = point.y + "px";
(async () => {
  const image = marker.getElement();
  await image.decode();
  const ir = image.getBoundingClientRect();
  const mr = container.getBoundingClientRect();
  const displacement = [
    ir.left + anchor[0] - mr.left - point.x,
    ir.top + anchor[1] - mr.top - point.y
  ];
  document.querySelector("#status").textContent = JSON.stringify({
    version: L.version, size, anchor,
    observedImageSize: [ir.width, ir.height], displacement
  }, null, 2);
})();
</script>
</html>
The displayed status should report anchor: [36, 58], image size [60, 80], and zero displacement. Change size to [90, 120]; the same calculation gives [54, 87]. To use the tight frame instead, change both the SVG's viewBox and the JavaScript viewBox array to 0 0 60 80. Keep them consistent.
The path includes a circular inner contour with fill-rule="evenodd", creating a real opening. MDN's fill-rule reference explains the rule. The example adds no border or transform to the map container; those would require care when comparing viewport rectangles with container coordinates.
Inspect the destination before changing the artwork
If your marker still misses its coordinate, inspect these in order:
- Confirm that the SVG image loaded and that the marker element has the intended pixel width and height.
- Locate the actual source tip, including any transforms applied inside the SVG.
- Check the full viewBox, its minimum coordinates, and its fitting mode.
- Recompute the anchor whenever you change the frame or icon size.
- Remove unrelated CSS overrides while testing, then check the final styling and intended display sizes again.
Keep the geographic coordinate fixed during this check. Moving that coordinate to compensate for image padding would conceal the artwork-placement error.
This is a browser marker workflow. A QGIS SVG marker uses its own destination controls and parameterized paint syntax; retain an ordinary SVG master for general browser delivery.
If your icon exists only as a PNG or JPG and you need editable contours, convert the artwork with PerfectVector, inspect the opening and tip, and save a clean SVG master. Then calculate its Leaflet anchor from the final source frame. Vectorization prepares the artwork; your map code supplies the locations and placement. If the only problem is an offset in an existing SVG, fix its frame or anchor directly. The image-vectorization guide explains when converting a raster source is useful.
FAQ
Is iconAnchor a latitude and longitude? No. It is a pixel position inside the displayed icon image, measured from its top-left corner. The marker's geographic position is supplied separately.
Why is my padded SVG still small after correcting its anchor? The empty source frame still occupies part of the image box. Correcting the anchor positions the tip; it does not remove that whitespace or enlarge the painted shape.
Should I always use half the width and the full height? Use that pair only when the visible attachment point actually falls there. Our asymmetric pin and padded source need different values, even though both are location-marker artwork.
Does converting a PNG to SVG fix the marker location? Conversion can provide editable artwork. The final source frame, displayed dimensions, anchor, and map coordinates still determine the marker's placement.
Sources
- Leaflet — Icon reference — Pixel dimensions, anchor origin, default centering, and geographic alignment.
- Leaflet — Markers With Custom Icons — Creating an icon and assigning it to a marker.
- Leaflet — Download — The stable release and its pinned JavaScript and CSS links.
- MDN — viewBox — The source coordinate rectangle used in the two frames.
- MDN — preserveAspectRatio — Uniform fitting and centered leftover space for xMidYMid meet.
- MDN — fill-rule — The even-odd rule used for the transparent opening.
More from the blog

Cytoscape.js SVG Node Images: Fix Fit and Padding
Fit custom SVG artwork inside Cytoscape.js nodes with a working example. Compare source whitespace, contain and cover, then check loading and label placement.

Responsive SVG Logos: Switch the Lockup at Small Sizes
Choose a detailed or compact SVG logo with picture media conditions. Test the selected source at three viewport widths, and separate art direction from scaling.