
Matplotlib SVG: Keep Plot and Logo Artwork as Paths
Export your Matplotlib plot as SVG, compose separate logo paths with svgutils, and check the delivered file for embedded pixels, placement, and font changes.
On this page
To keep a logo vector inside a Matplotlib figure, export the plot as SVG and compose it with the logo's existing SVG geometry. Placing a PNG with OffsetImage can produce an SVG containing a raster image alongside vector plot lines. The extension alone does not tell you which parts are paths.
This guide keeps those jobs separate: Matplotlib draws the plot from its data, and svgutils places a decorative badge beside it. If the original artwork is already vector, use it. If only a suitable raster illustration survives, recover that illustration separately. Keep numerical marks, axes, and labels in the plotting source.
The short workflow
Export the plot, compose the separate artwork, inspect the resulting SVG, then reopen the exact file you will deliver. Keep the plotting script and artwork master so the next data revision can regenerate the figure.
Choose what belongs in the plotting source
A logo is artwork; an axis tick is part of the plot. Treating both as a single image makes later revisions harder.
| Figure content | Preferred source | What to verify |
|---|---|---|
| Lines, markers, axes, and data labels | Matplotlib plotting code | Values, labels, and plotting choices |
| Existing vector logo or illustration | Its SVG master | Paths, bounds, and dependencies |
| Raster photograph or microscopy panel | Original raster image | Resolution at the final size |
| Simple decorative motif whose vector source is lost | A separately inspected recovery candidate | Shape fidelity and unwanted regions |
An all-vector figure is not necessary when some panels are photographs. Preserve those as raster. The goal is to retain the right source for each component, then check the assembled result.
Matplotlib's savefig reference documents selecting an output format explicitly. Its OffsetImage API describes an image container, rather than an SVG-path importer. For the file-level diagnosis, see how to find raster images inside an SVG.
What the delivered files contain
We ran the example with Python 3.12, Matplotlib 3.10.7, and svgutils 0.3.4. The badge is an original two-path drawing. The four plotted values are illustrative data, not an experiment or a product benchmark.
The comparison uses the same plot in both files. On the left, a 32 × 32 PNG badge is inserted with OffsetImage. On the right, its SVG paths are composed with the exported plot. The enlarged regions come from those actual delivered files.
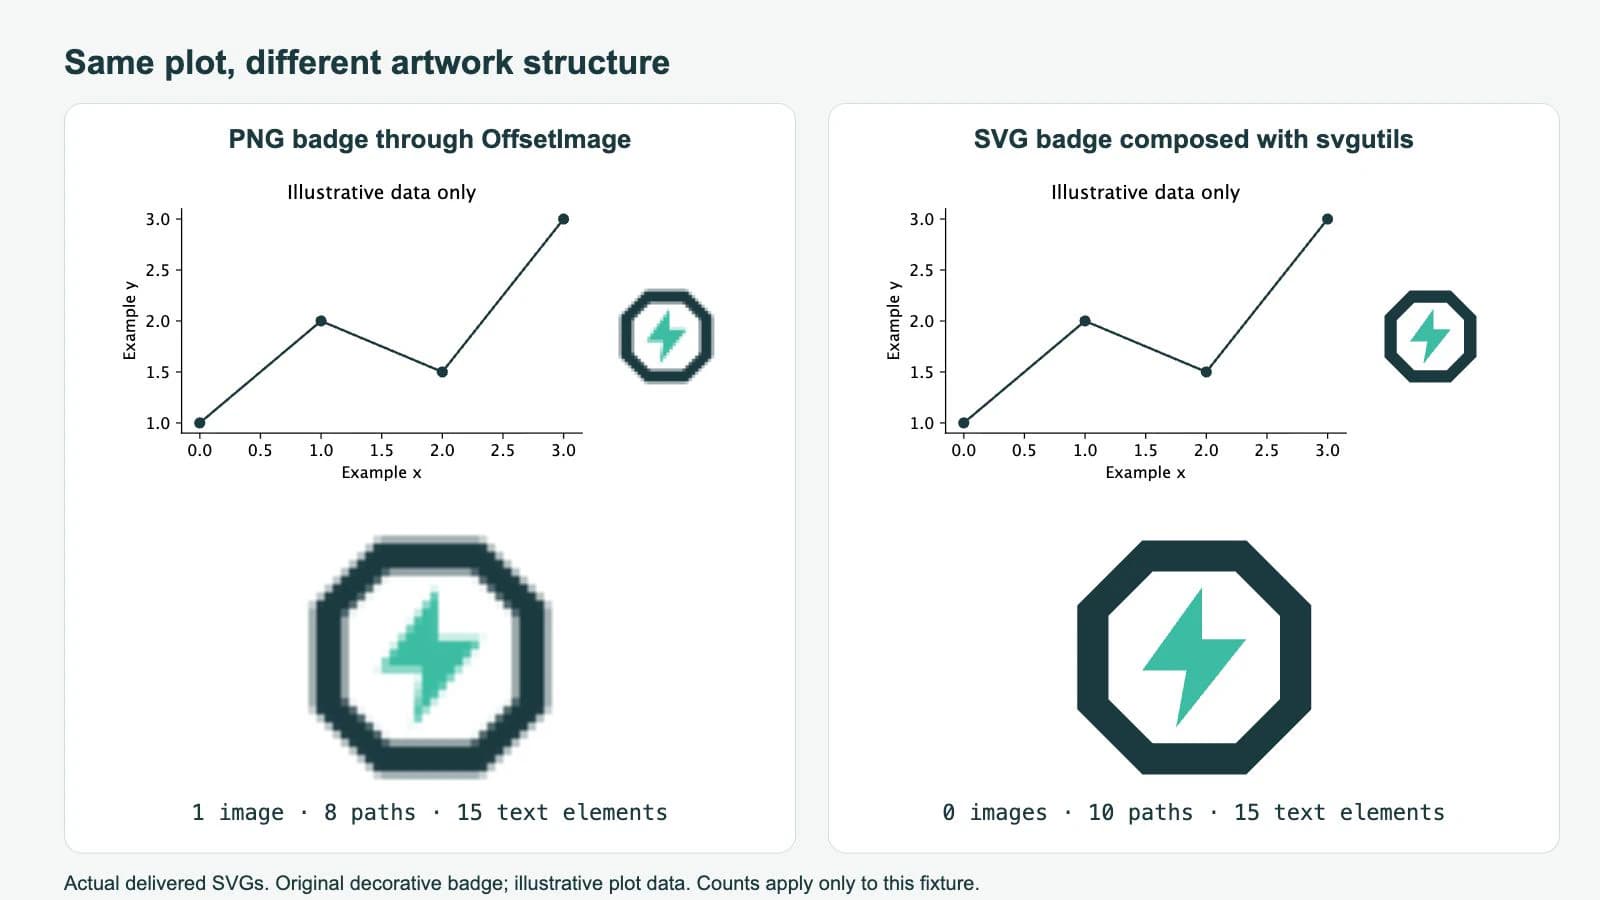
Counting SVG elements gave these results:
| File | Image elements | Path elements | Text elements |
|---|---|---|---|
| Plot alone | 0 | 8 | 15 |
| Plot with PNG badge | 1 | 8 | 15 |
| Plot with SVG badge paths | 0 | 10 | 15 |
These counts apply to this small fixture. A path count is not a quality score, and zero image elements does not prove that every SVG feature will survive another application. It does establish that the badge in this composed file is geometry rather than an embedded PNG.
Export a plot with predictable bounds
Install the versions used here in a project environment:
python -m pip install matplotlib==3.10.7 svgutils==0.3.4Save this as plot.py and run it in an empty working folder:
import matplotlib
matplotlib.use("Agg")
import matplotlib.pyplot as plt

plt.rcParams["svg.fonttype"] = "none"

fig = plt.figure(figsize=(6, 3), dpi=72)
ax = fig.add_axes([0.14, 0.22, 0.58, 0.65])
ax.plot([0, 1, 2, 3], [1, 2, 1.5, 3],
        marker="o", color="#173b40")
ax.set(xlabel="Example x", ylabel="Example y",
       title="Illustrative data only")
ax.spines[["top", "right"]].set_visible(False)
fig.savefig("plot.svg", format="svg")
plt.close(fig)
The axes occupy only part of the figure, leaving room for the badge on the right. This export has a viewBox of 0 0 432 216, with outer dimensions of 432pt by 216pt.
Keep those bounds stable while placing external artwork. Adding bbox_inches="tight" changes the saved bounds, as the savefig documentation explains. If you need tight cropping, inspect the exported viewBox and update your composition coordinates afterward.
The svg.fonttype="none" setting keeps the example labels as text. Matplotlib's font documentation describes SVG text and path output choices. Live text still needs a suitable font in the receiving environment. If you need fixed letter shapes, choose path output deliberately and keep the plotting source for label edits. The SVG font-change guide covers that trade-off.
Compose the artwork without rasterizing it
Save this original badge as badge.svg beside plot.svg:
<svg xmlns="http://www.w3.org/2000/svg"
     width="100" height="100" viewBox="0 0 100 100">
  <path fill="#173b40" fill-rule="evenodd"
        d="M30 5H70L95 30V70L70 95H30L5 70V30Z
           M34 17L17 34V66L34 83H66L83 66V34L66 17Z"/>
  <path fill="#28bfa3" d="M53 23L30 55H47L43 77L70 43H53Z"/>
</svg>
Then run this composition script:
import svgutils.transform as sg

page = sg.SVGFigure("432pt", "216pt")
page.root.set("viewBox", "0 0 432 216")

chart = sg.fromfile("plot.svg").getroot()
badge = sg.fromfile("badge.svg").getroot()
badge.moveto(332, 76, scale_x=0.64)

page.append([chart, badge])
page.save("vector-logo.svg")
This follows the load, transform, append, and save approach in the svgutils figure-composition tutorial. We used scale_x, the argument supported by svgutils 0.3.4; the older tutorial shows a different scaling argument.
The badge's 100-unit artwork becomes 64 units wide. Its upper-left corner sits at (332, 76) inside the plot's coordinate system. The explicit outer dimensions and viewBox keep that placement unambiguous for this fixture. These are page coordinates, not data coordinates: moving a data point in the plot will not move the badge with it.
For annotations tied to a changing data point, maintain a deliberate mapping from the plot's coordinates to the exported page, or use a composition tool that provides that association. A fixed page placement suits a corner logo or a separate illustrative panel.
The SVG master can contain features beyond paths. An SVG that already embeds a PNG remains mixed content when composed. Also check referenced IDs, fonts, and externally linked assets when combining more complex files. This example avoids those dependencies in the badge.
Inspect the file, then test a revision
Open vector-logo.svg in a browser or your intended editor. Check the badge's central opening, the plot labels, and the empty space between them. Inspect the file at the size you will actually use, as well as enlarged.
A small XML check can confirm the structure without relying on the preview:
import xml.etree.ElementTree as ET

root = ET.parse("vector-logo.svg").getroot()
ns = "{http://www.w3.org/2000/svg}"
for tag in ("image", "path", "text"):
    print(tag, len(root.findall(".//" + ns + tag)))
For the provided fixture, this prints image 0, path 10, and text 15. The raster comparison prints image 1, while retaining the plot's eight paths. In that comparison, the image reference contains PNG data; it is self-contained raster content, not a missing external logo file.
Now change the final illustrative y-value in plot.py, rerun it, and rerun the composition. The plot should change while the badge stays in its reserved page position. That revision check catches a workflow that looks right once but depends on an old plot export.
Check the next delivery step separately. If the figure will enter a document, the LaTeX SVG workflow explains export and label choices. A successful browser preview alone does not establish journal compliance or preservation in a final PDF.
Recover only the artwork that needs recovery
When the plot source exists, export from it. Vectorization cannot restore numerical data or plotting commands from a screenshot.
PerfectVector fits the narrower case where a simple decorative logo or illustration survives only as a raster image. With its scientific artwork recovery workflow, crop to that artwork, preview the vector candidate, and inspect openings, thin shapes, and unwanted background regions. Keep axes, measured marks, and labels out of the trace. Compose the accepted artwork SVG with the native plot, then repeat the delivered-file checks.
Use the original vector master whenever you have it. Redraw a simple mark manually when tracing loses a detail that matters. Keep photographic panels raster. The image-vectorization overview explains what tracing can recover before you choose that route.
FAQ
Does saving a Matplotlib figure as SVG make a PNG logo vector? No. In the tested OffsetImage workflow, the plot exports as vector geometry while the PNG logo remains an image element inside the SVG.
Can I place the SVG logo using data coordinates? The composition shown here uses exported page coordinates. A logo tied to a data point needs an explicit coordinate mapping or a tool that maintains that association.
Why did my labels become paths? Matplotlib's SVG font output setting controls whether labels are exported as text or glyph paths. Choose that setting before exporting, and keep the plotting source for later wording changes.
Sources
- Matplotlib — savefig — Explicit SVG export and the effect of tight bounding boxes.
- Matplotlib — OffsetImage — Image-container behavior used for the raster comparison.
- Matplotlib — Fonts in Matplotlib — SVG text and glyph-path output choices.
- svgutils — Creating publication-quality figures — Separate plot export, SVG composition, transforms, and saving an assembled figure.
Export the plot from its code and keep the artwork separate. If only a raster decorative motif remains, prepare an SVG artwork candidate, inspect its openings and boundaries, then compose it with your plot and check the exact delivered file for pixels, placement, and label changes.
More from the blog

jsPDF SVG: Keep Logo Paths in a Browser-Made PDF
Use svg2pdf.js with jsPDF to place an SVG logo, preserve supported paths, set its PDF size, and check the saved file against a rasterized export of that artwork.

SVG in WPF: Choose a Renderer or a XAML Drawing
Use SVG artwork in WPF with a renderer, a native DrawingImage, or a PNG export. Follow an original icon example and check bounds, colors, and dependencies.