
SVG Scatter Markers in Matplotlib: Check the Path
Use a simple SVG path as a Matplotlib scatter marker. Reproduce centering, orientation, holes, and size checks in actual SVG and PDF exports.
On this page
To use an SVG as a custom Matplotlib scatter marker, convert the supported geometry into a matplotlib.path.Path, center it around (0, 0), and pass that object to scatter(marker=...). The marker color and size then come from the plot. Matplotlib's marker API accepts a Path; it does not take an arbitrary SVG document as a marker filename.
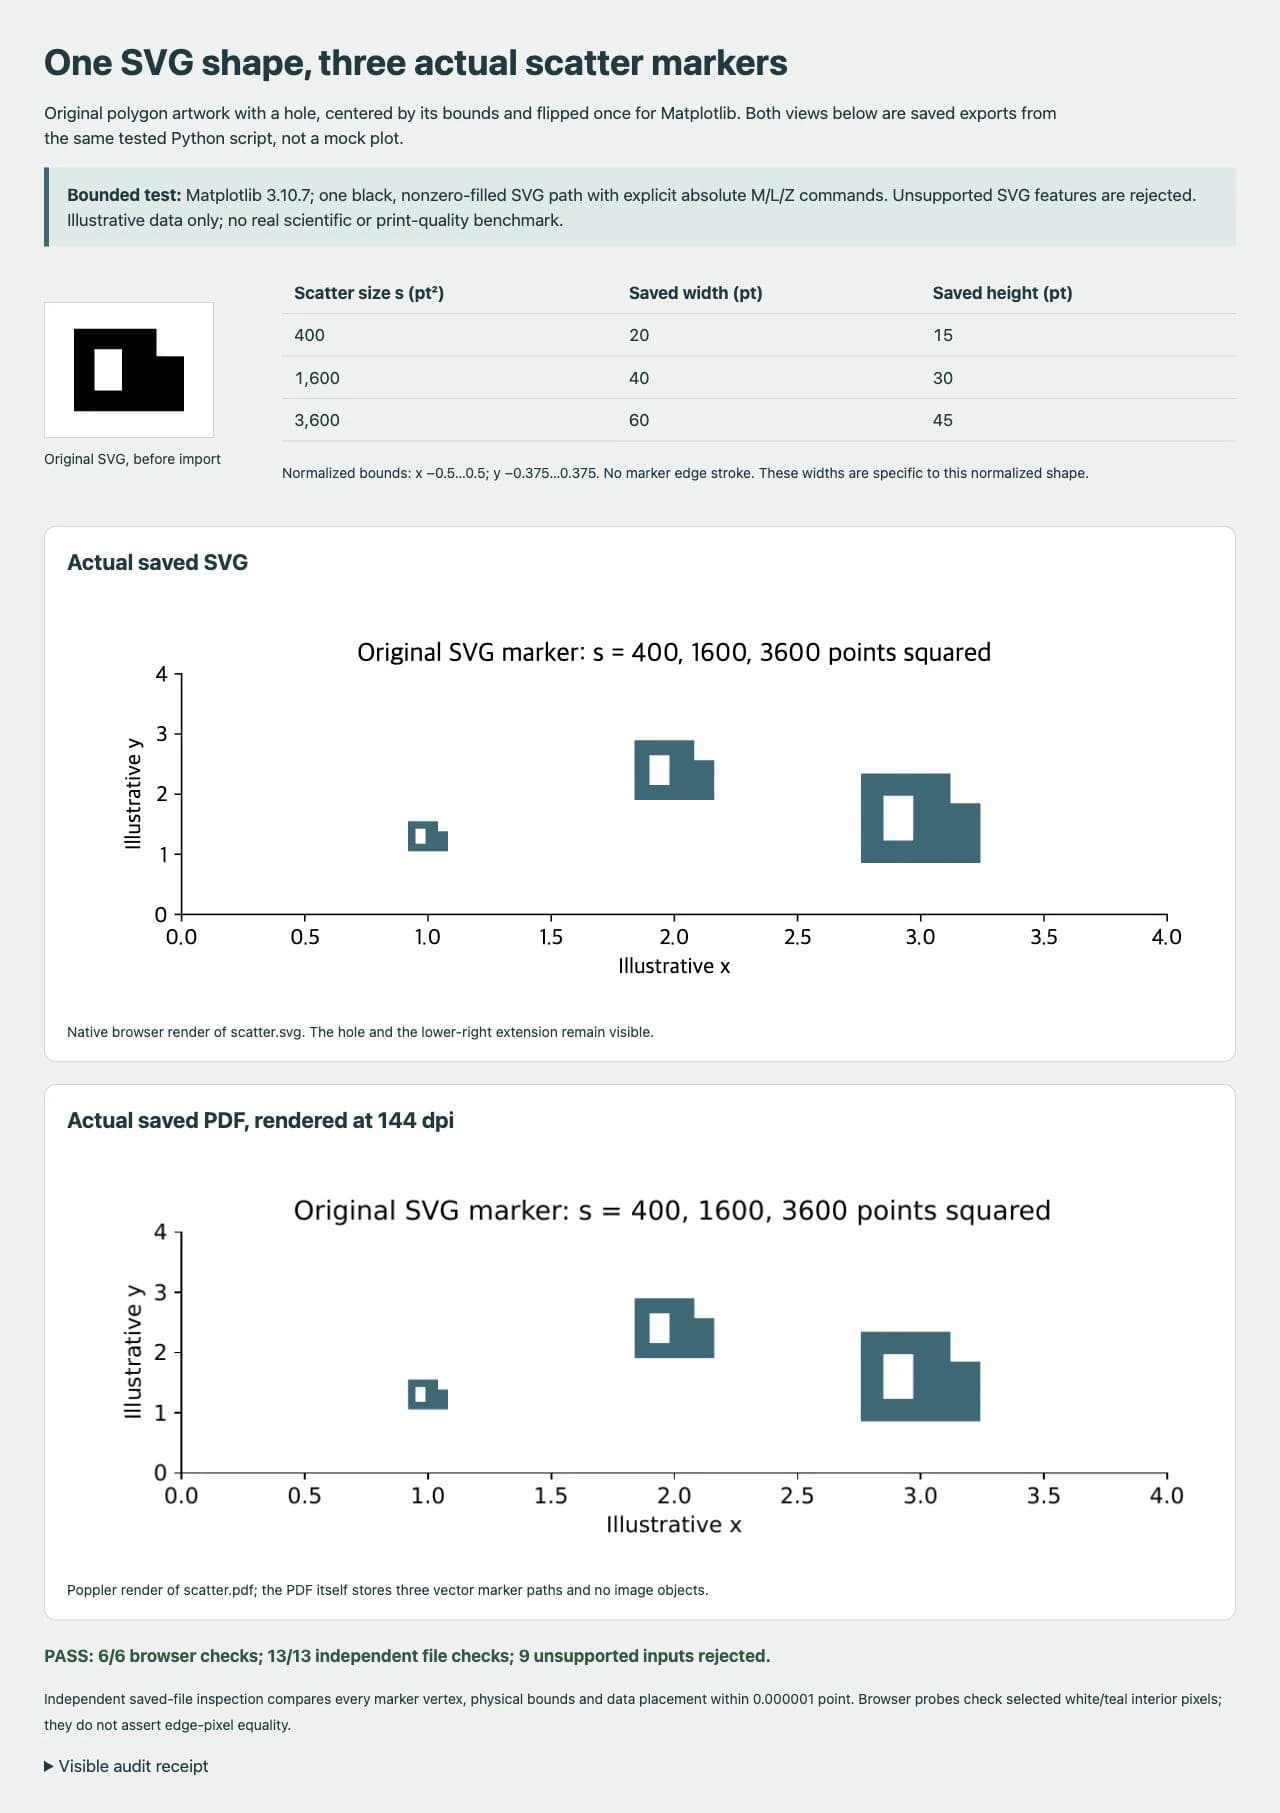
This tutorial uses an original asymmetric polygon with a rectangular hole. The complete script below handles one deliberately small SVG subset and rejects features it cannot preserve. We ran it with Matplotlib 3.10.7, inspected the saved SVG and PDF paths, and checked both rendered outputs.
If you want one illustration beside an exported chart, use the separate Matplotlib SVG artwork composition guide. A scatter marker repeats at data coordinates, so its center, orientation, and size need a different check.
1. Start with one supported shape
You need Python with Matplotlib and NumPy available, plus permission to write an output directory. The example includes its original SVG, so you do not need to download an icon. The three plotted coordinates are illustrative values, not research observations.
The parser accepts exactly one black-filled path inside an SVG root with a viewBox. Each contour must close with Z; every coordinate pair needs an explicit uppercase M or L. It supports a compound path with an outer contour and a hole using opposite winding under fill-rule="nonzero".
It rejects curves, relative commands, transforms, strokes, CSS, multiple path elements, text, clipping, gradients, and other colors. It also rejects extra root attributes such as width and height. This restriction makes the example inspectable; it is not a general SVG importer. Keep an untouched copy of your artwork before preparing a compatible input.
A Matplotlib Path stores vertices and drawing codes, rather than the full SVG paint model. The Path API defines the move, line, and close operations used here. If your symbol needs multiple colors or effects, choose a workflow that preserves those features instead of silently discarding them to fit this parser.
2. Run the complete marker example
Save this as scatter_marker.py, then run python scatter_marker.py in the same directory. It creates marker-output/marker.svg, scatter.svg, scatter.pdf, and a PNG preview. The generated SVG source and all plot settings are included here.
from pathlib import Path as FilePath
import re
import xml.etree.ElementTree as ET

import matplotlib
matplotlib.use("Agg")
import matplotlib.pyplot as plt
from matplotlib.path import Path
import numpy as np

SVG = '''<svg xmlns="http://www.w3.org/2000/svg" viewBox="0 0 100 80">
  <path fill="#000000" fill-rule="nonzero"
        d="M10 10 L70 10 L70 30 L90 30 L90 70 L10 70 Z
           M25 25 L25 55 L45 55 L45 25 Z"/>
</svg>'''


def svg_marker(svg_text):
    """One black, nonzero-filled path; explicit absolute M/L/Z only."""
    namespace = "{http://www.w3.org/2000/svg}"
    root = ET.fromstring(svg_text)
    if root.tag != namespace + "svg" or set(root.attrib) != {"viewBox"}:
        raise ValueError("Use only an SVG root with a viewBox")
    view = np.array([float(value) for value in root.attrib["viewBox"].split()])
    if view.shape != (4,) or not np.isfinite(view).all() or (view[2:] <= 0).any():
        raise ValueError("Invalid viewBox")
    if len(root) != 1 or root[0].tag != namespace + "path":
        raise ValueError("Use exactly one path, with no groups or other elements")
    node = root[0]
    if any((text or "").strip() for text in [root.text, node.text, node.tail]):
        raise ValueError("Text content is not supported")
    if set(node.attrib) - {"d", "fill", "fill-rule"} or len(node):
        raise ValueError("Unsupported path attribute or child element")
    if node.get("fill", "black") not in {"black", "#000", "#000000"}:
        raise ValueError("Use one solid black fill")
    if node.get("fill-rule", "nonzero") != "nonzero":
        raise ValueError("Use nonzero winding; evenodd is not converted here")
    data = node.get("d", "")
    pattern = r"[MLZ]|[-+]?(?:\d*\.\d+|\d+\.?)(?:[eE][-+]?\d+)?"
    tokens = re.findall(pattern, data)
    if re.sub(pattern, "", data).strip(" ,\n\r\t"):
        raise ValueError("Only explicit absolute M, L and Z commands are supported")
    vertices, codes = [], []
    index, start, open_contour, lines = 0, None, False, 0
    while index < len(tokens):
        command = tokens[index]
        if command in {"M", "L"}:
            if index + 2 >= len(tokens) or tokens[index + 1] in {"M", "L", "Z"} or tokens[index + 2] in {"M", "L", "Z"}:
                raise ValueError("Each M/L needs one explicit coordinate pair")
            point = tuple(float(value) for value in tokens[index + 1:index + 3])
            if not np.isfinite(point).all():
                raise ValueError("Coordinates must be finite")
            if command == "M":
                if open_contour:
                    raise ValueError("Close each contour with Z")
                start, open_contour, lines = point, True, 0
                codes.append(Path.MOVETO)
            else:
                if not open_contour:
                    raise ValueError("Start each contour with M")
                lines += 1
                codes.append(Path.LINETO)
            vertices.append(point)
            index += 3
        elif command == "Z":
            if not open_contour or lines < 2:
                raise ValueError("A closed contour needs at least three vertices")
            vertices.append(start)
            codes.append(Path.CLOSEPOLY)
            open_contour = False
            index += 1
        else:
            raise ValueError("Repeat M/L explicitly before coordinate pairs")
    if open_contour or not vertices:
        raise ValueError("Supply nonempty closed contours")
    path = Path(np.array(vertices), codes)
    box = path.get_extents()
    if box.width <= 0 or box.height <= 0:
        raise ValueError("Path needs nonzero width and height")
    if box.x0 < view[0] or box.y0 < view[1] or box.x1 > view[0] + view[2] or box.y1 > view[1] + view[3]:
        raise ValueError("Path outside viewBox: resolve clipping before import")
    center = np.array([(box.x0 + box.x1) / 2, (box.y0 + box.y1) / 2])
    centered = (path.vertices - center) * np.array([1, -1])
    return Path(centered, path.codes)


if __name__ == "__main__":
    output = FilePath("marker-output")
    output.mkdir(exist_ok=True)
    (output / "marker.svg").write_text(SVG)
    marker = svg_marker(SVG)
    plt.rcParams.update({"svg.fonttype": "none", "pdf.fonttype": 42,
                         "font.family": "DejaVu Sans", "font.size": 11})
    fig, ax = plt.subplots(figsize=(8, 3), dpi=144)
    fig.subplots_adjust(left=.1, right=.96, bottom=.24, top=.8)
    ax.scatter([1, 2, 3], [1.3, 2.4, 1.6], s=[400, 1600, 3600],
               marker=marker, color="#2f6977", linewidths=0, edgecolors="none")
    ax.set(xlim=(0, 4), ylim=(0, 4), xlabel="Illustrative x", ylabel="Illustrative y",
           title="Original SVG marker: s = 400, 1600, 3600 points squared")
    ax.spines[["top", "right"]].set_visible(False)
    fig.savefig(output / "scatter.svg", format="svg")
    fig.savefig(output / "scatter.pdf", format="pdf")
    fig.savefig(output / "scatter.png", format="png")
    plt.close(fig)
Open both scatter.svg and scatter.pdf. You should see three teal versions of the same shape: a rectangular hole on the left and a step extending toward the lower right. Compare the smallest marker at its intended display size as well as the enlarged view.
3. Check the center and flip Y once
The source artwork occupies x=10…90 and y=10…70. Its bounding-box center is (50, 40). Subtracting that center gives bounds of −40…40 horizontally and −30…30 vertically. This is bounding-box centering, not a centroid or an estimate of visual balance.
The source's lower-right step is useful because a symmetric circle would hide a vertical flip. In the initial SVG coordinate system, positive Y points downward. The script negates Y once to preserve the source's displayed orientation in the normal upward-Y plot.
Both contours receive the same transform. Their relative winding stays opposite, so the rectangular opening remains a hole. SVG's nonzero fill rule depends on contour direction; an evenodd source is explicitly rejected here rather than treated as equivalent.
Matplotlib then normalizes this centered Path. In the tested version, the result spans −0.5…0.5 in X and −0.375…0.375 in Y. The point supplied to scatter lands at the center of those bounds. You can deliberately choose another anchor for a specialized symbol, but do not assume that a source SVG's top-left corner is an appropriate data anchor.
4. Read scatter size in points squared
The scatter API defines s in points squared, with one typographic point equal to 1/72 inch. A nonzero marker edge can enlarge its visible extent. The example sets linewidths=0 and edgecolors="none" to keep the size check about the filled geometry.
For this normalized marker, width is one marker unit and height is 0.75 units. Its saved width is therefore sqrt(s) points and its height is 0.75 * sqrt(s) points.
s (points squared) | Expected and measured width | Expected and measured height |
|---|---|---|
| 400 | 20 pt | 15 pt |
| 1,600 | 40 pt | 30 pt |
| 3,600 | 60 pt | 45 pt |
These are dimensions of this particular normalized shape, not its painted area. A different aspect ratio, anchor, or edge stroke changes the relationship between the size parameter and the visible symbol. Increasing s fourfold doubles the dimensions in this example.
We inspected the actual saved SVG coordinates and the PDF's filled-path operations with a numeric tolerance of 0.000001 point. All three markers had the expected bounds, centered data placement, and transformed vertices. The saved SVG contained no image elements, and the PDF contained no image objects.
We also rendered the saved PDF at 144 dpi and checked three declared interior positions: the hole was white, the upper-right notch was white, and the lower-right extension was teal. Native browser rendering of the actual SVG passed the same interior checks. This verifies the chosen orientation and opening; it does not claim identical antialiased edges across renderers or support for arbitrary SVG artwork.
5. Fix the cause before adjusting the size
| Symptom | Check and recovery |
|---|---|
| The parser raises an unsupported-feature error | Inspect the named feature. Prepare a separate compatible polygon input, or use a fuller conversion method and test it. Removing an attribute without preserving its effect can change the artwork. |
| The shape is upside down | Check whether Y was already inverted before this function. Apply the coordinate change once, then compare an asymmetric feature. |
| The symbol sits away from the data point | Inspect its bounds and chosen anchor. This function centers the artwork bounds, regardless of whitespace in the viewBox. |
| The hole fills in | Inspect the contour directions and fill rule. Keep opposite winding for this nonzero-filled fixture; the parser does not convert evenodd geometry. |
| The saved file contains a raster symbol | Inspect the exported elements or resources. The presence of an SVG or PDF filename alone does not prove that every plotted element is vector. |
| Small markers lose useful detail | Review the figure at its final size. Enlarge the marker, simplify the symbol, or use a built-in marker if it communicates the category more clearly. |
For file inspection beyond this fixture, see how to find raster content inside SVG. For the whole figure, review font size and line width at publication size; a correct marker path can still be too intricate for a small legend or crowded panel.
Before using your own marker in a finished figure, check its smallest size, legend appearance, overlapping points, and exported SVG/PDF. Keep the plotting data, axes, labels, and scale mapping in your plotting workflow. A custom icon does not replace those numerical definitions.
When raster artwork needs a new path
If the only surviving symbol is a flat raster drawing, PerfectVector's scientific diagram to SVG workflow can help recover editable artwork. Compare the recovered outline and every opening with the original before adapting it to your marker pipeline. Keep an existing clean SVG as the source when you already have one.
Vector recovery does not reconstruct the chart's underlying data or guarantee compatibility with this restricted parser. Preserve photographs and continuous-tone illustrations when their raster appearance is part of the figure, and choose an image-based placement method suited to that content.
FAQ
Can I pass an SVG filename directly to Matplotlib scatter? No. The marker API accepts supported marker descriptions, including a Matplotlib Path. This example converts a restricted SVG path into that object before calling scatter.
Why is my custom marker upside down? The source SVG and plot may use different Y directions. This example negates SVG Y once; inspect an asymmetric feature to avoid applying the flip twice.
Does s equal the painted area of my SVG shape? Do not use it as a measured painted-area value. Scatter defines s in points squared, while the normalized shape and edge stroke determine its visible dimensions. This fixture has widths of 20, 40, and 60 points at s values of 400, 1600, and 3600.
Does this code preserve every SVG feature? No. It supports one black, nonzero-filled path with explicit absolute M, L, and Z commands and closed contours. Unsupported paint, geometry commands, transforms, and extra elements raise an error.
Sources
- Matplotlib scatter API — Defines the size parameter, marker input, and edge-width interaction.
- Matplotlib 3.10.7 marker API — Documents Path markers and normalized marker coordinates for the tested release.
- Matplotlib Path API — Defines vertices, drawing codes, and closed contours.
- SVG coordinate systems — Establishes the initial coordinate directions used in the orientation check.
- SVG fill rules — Explains how contour direction affects the nonzero-filled opening.
For a raster-only symbol, recover editable diagram artwork, compare its outline and holes with the source, and test the adapted path in your actual figure before delivery.
More from the blog

SVG in LaTeX: Keep Shapes and Typeset Figure Labels
Choose a PDF or PDF plus LaTeX workflow for your SVG illustration. Keep labels editable, understand Inkscape dependencies, and check the final document PDF.
Ignore Transparent SVG Areas in Konva Hit Detection
Make transparent SVG image areas ignore clicks in Konva. Reproduce cache-based hit detection, test holes and backgrounds, and rebuild hits after source changes.