
Scientific Figure Font Size: Check Labels and Lines
Calculate label size and line width after a figure is reduced. Use an editable SVG example, check a publisher's requirements, and inspect the final document.
On this page
- Read the target journal's rules first
- Calculate what reduction does
- Try a complete SVG with live labels
- Inspect the assembled document at its actual size
- Where PerfectVector fits in a scientific figure
- FAQ
- Does SVG keep the font size unchanged when I resize it?
- Is 6 pt acceptable for every scientific figure?
- Can I vectorize a screenshot of a scientific plot?
- Sources
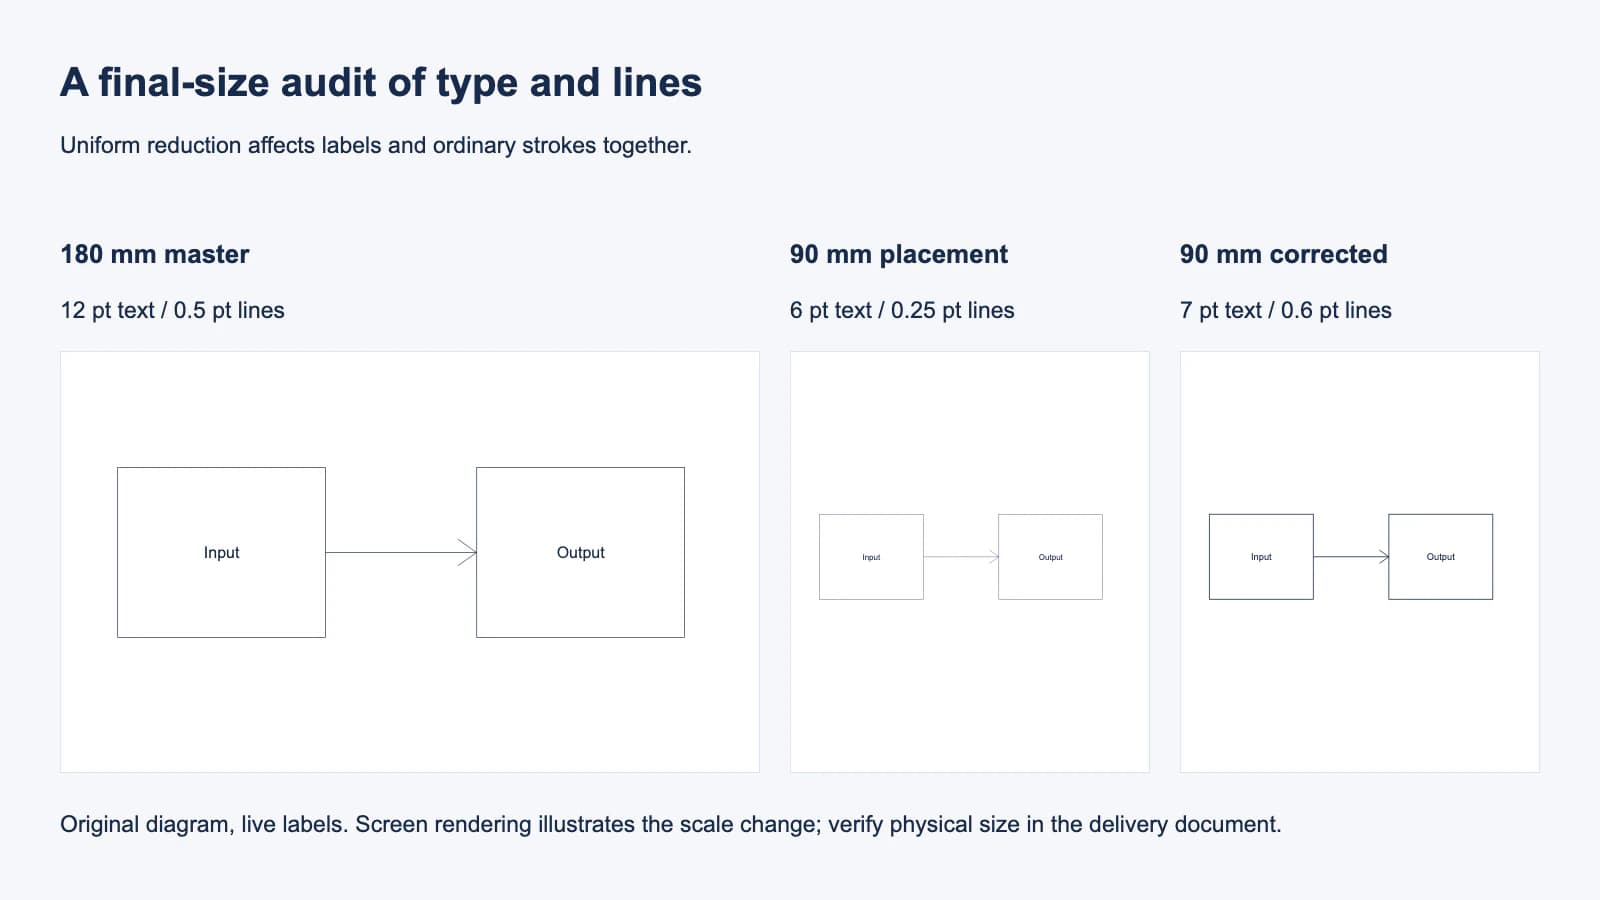
Choose scientific figure font size and line width at the size the reader will receive. A 12 pt label in a 180 mm master becomes 6 pt when the whole figure is placed at 90 mm. A 0.5 pt line becomes 0.25 pt. Vector edges can remain sharp while the labels and lines become too small.
This guide is for researchers assembling a journal figure from diagrams or plots. It uses an original two-box diagram with live labels, so you can check the geometry without changing experimental data. Keep plots, measurements, micrographs, and scale bars tied to their original sources. Vectorization is useful only when a separate raster illustration needs recoverable shapes.
Check the smallest intended reproduction
Find the journal's final figure width, calculate the reduction factor, then audit the smallest text and thinnest meaningful line in the assembled document. A large preview is a useful editing view; it cannot establish readability at print size.
Read the target journal's rules first
There is no single font size that satisfies every scientific publisher. For example, the AAS Journals graphics guide accepts a minimum 6 pt font size and asks for lines at least 0.5 pt thick. Nature's research figure guide specifies 89 mm and 183 mm printed widths, with ordinary text between 5 pt and 7 pt. Those are different publication contexts.
Write down the requirements for your particular journal and submission stage: the intended width, text range, line requirement, accepted file format, and whether text must remain editable. Nature's guide asks authors to keep text editable, embed fonts, and avoid outlining text. Do not turn labels into paths simply because that is convenient for distributing a logo.
The 180 mm and 90 mm widths below are our example dimensions. They are not Nature's specified column widths. If your target is 89 mm, use 89 in the calculation.
Calculate what reduction does
The reduction factor is the final width divided by the master width, provided you scale the entire figure uniformly. Multiply each source text size and ordinary stroke width by that factor.
scale = final width / master width
final text size = source text size × scale
final line width = source line width × scale

90 / 180 = 0.5
12 pt × 0.5 = 6 pt
0.5 pt × 0.5 = 0.25 pt
For the AAS example, the labels meet the cited minimum after reduction, but the lines do not. For a little room above both AAS minimums, revise the master to 14 pt labels and 1.2 pt lines. At half width, the intended sizes become 7 pt and 0.6 pt. These example choices are for the cited AAS context; choose a value inside your own target's allowed range.
| Element | 180 mm master | Placed at 90 mm | Revised master for the same placement |
|---|---|---|---|
| Label text | 12 pt | 6 pt | 14 pt, giving 7 pt final |
| Box outlines | 0.5 pt | 0.25 pt | 1.2 pt, giving 0.6 pt final |
| Figure width | 180 mm | 90 mm | Keep placement at 90 mm |
Point size describes the type's size setting, not the height of every visible letter. A lowercase letter and a capital can have different ink heights at the same point size. Do not measure the top and bottom of a glyph and call that its font size.
Try a complete SVG with live labels
An SVG (Scalable Vector Graphics) file describes geometry and can also retain text. The following example has no external images, imported fonts, or measured data. Save it as figure-master.svg in a plain-text editor and open it in a browser or your vector editor.
<svg xmlns="http://www.w3.org/2000/svg"
     width="180mm" height="100mm" viewBox="0 0 180 100">
  <rect width="180" height="100" fill="white"/>
  <g fill="none" stroke="#172b4d" stroke-width="0.176389">
    <rect x="15" y="25" width="55" height="45"/>
    <rect x="110" y="25" width="55" height="45"/>
    <path d="M70 47.5 H110 M105 44 L110 47.5 L105 51"/>
  </g>
  <g fill="#172b4d" font-family="Arial, sans-serif"
     font-size="4.233333" text-anchor="middle">
    <text x="42.5" y="49">Input</text>
    <text x="137.5" y="49">Output</text>
  </g>
</svg>
The SVG viewBox documentation explains how the internal coordinate rectangle maps to the viewport. Here, 180 internal units span a 180 mm width. The 4.233333-unit font is therefore approximately 4.233333 mm, or 12 pt, in the master. The 0.176389-unit stroke is approximately 0.5 pt.
- Open the master and confirm that both labels are present and the arrow meets the boxes.
- Make a copy with
width="90mm"andheight="50mm". KeepviewBox="0 0 180 100". That changes the reproduction size while retaining the source geometry. - In a corrected copy, change
stroke-width="0.176389"tostroke-width="0.423333"andfont-size="4.233333"tofont-size="4.938889". The intended final sizes are 0.6 pt lines and 7 pt labels. - Place or export the corrected copy at 90 mm wide in the document that will carry the figure. Recheck the exported document, including any later resizing.
If the labels disappear, first check the text contents and available font. If the figure is stretched, restore the intended width-to-height ratio. If the exported document puts it at another width, recalculate using that actual width before changing the artwork again.
Method note: We rendered these SVG versions in Chromium, measured their viewport widths, and inspected a 90 mm PDF export of the corrected diagram. Its extracted labels were approximately 7.00 pt and its ordinary outline strokes approximately 0.60 pt. Export rounding is another reason to leave room above a strict minimum. That checks this example's export, not another application's behavior or physical printing.
Inspect the assembled document at its actual size
The final document is the useful checkpoint because layout can resize a correct source. Check its placement width numerically, then inspect every panel, legend, subscript, arrowhead, and dashed line. Look for collisions caused by larger type or heavier lines. A journal may also resize figures during production, so inspect the publication proof when it arrives.
For a paper check, print without a fit-to-page scaling option and measure the figure width with a ruler. A PDF viewer's 100% zoom can be convenient, but screen scaling and display density make it an unreliable substitute for a measured print. We have not physically printed the example shown here.
If the small version is crowded, simplify the layout or rebuild it at the intended final dimensions. Remove optional decoration before shrinking essential labels. Keep different series distinguishable with meaningful line or marker styles; the AAS guide specifically asks authors to check dotted and dashed lines when the figure is small.
For the export step itself, use the related guides to keep SVG labels in a LaTeX document, retain plot sources with Matplotlib artwork, or inspect a PDF before converting it to SVG. This audit comes after those source and export choices.
Where PerfectVector fits in a scientific figure
PerfectVector can help recover vector shapes from a separate raster diagram illustration when its original vector file is missing. Keep the recovered illustration separate from live labels and data-bearing marks, then place it in the figure at the intended final size. The scientific diagram to SVG workflow is useful for that limited recovery step.
Replot numerical results from their data, preserve micrographs as source images, and rebuild missing labels as text. Tracing a screenshot cannot recover the original measurements, font settings, or publication requirements. If you already have an editable SVG or plotting source, revise that source directly.
Finish when the placed width is correct, the smallest label and thinnest line meet your target's rules, and the exported file retains the required text and artwork. Keep the master with the submission files so a later width change can be corrected. The blog's workflow guides cover the remaining format and delivery checks.
FAQ
Does SVG keep the font size unchanged when I resize it?
Uniform resizing of the whole SVG scales the visible text along with the artwork. In the example, placing a 180 mm master at 90 mm halves the effective label point size.
Is 6 pt acceptable for every scientific figure?
No. It matches the minimum in the cited AAS guide, but your journal, figure type, and submission stage can have different requirements. Check the target instructions and the final proof.
Can I vectorize a screenshot of a scientific plot?
Use the original data and plotting source for measured plots. A traced screenshot does not restore data or the original type settings. Reserve vectorization for a separate illustration whose shapes need recovery.
Sources
- AAS Journals — Graphics guide — Provides the font and line minimums used for this worked example and asks for small-size checks of dashed lines.
- Nature — Building and exporting figure panels — Shows how a different publisher specifies printed width, text size, and editable text.
- MDN — SVG viewBox — Explains the coordinate-to-viewport mapping used by the complete SVG example.
If a separate raster illustration is the missing piece, recover its shapes with PerfectVector. Place the result beside live labels, then check the smallest text and thinnest line in your final-size document.
More from the blog

jsPDF SVG: Keep Logo Paths in a Browser-Made PDF
Use svg2pdf.js with jsPDF to place an SVG logo, preserve supported paths, set its PDF size, and check the saved file against a rasterized export of that artwork.

ReportLab SVG: Keep Logo Paths Sharp in Generated PDFs
Place SVG logos in ReportLab PDFs with svglib, preserve their proportions, and check the finished file for vector paths, correct size, and missing details.