
ReportLab SVG: Keep Logo Paths Sharp in Generated PDFs
Place SVG logos in ReportLab PDFs with svglib, preserve their proportions, and check the finished file for vector paths, correct size, and missing details.
On this page
Use svglib.svg2rlg() to read an SVG into a ReportLab Drawing, then place that drawing with renderPDF.draw(). Give it a measured box on the page and use one scale factor for both axes. This keeps suitable logo geometry as PDF drawing instructions instead of inserting a bitmap screenshot.
The useful test is the finished PDF: did the emblem keep its proportions, colors, and small openings at the size your document needs? A successful Python call does not answer those questions. The example below places the same original emblem twice and checks the file it produces.
If you already have the logo as editable vector artwork, start there. If only a PNG or JPG survives, recover a vector master before building the document. Photos and numerical charts need a different source decision.
Import the artwork as a drawing
svglib's documented workflow converts SVG into ReportLab drawing objects. ReportLab's graphics guide explains that these drawings can be rendered onto a canvas or used as Platypus flowables. For this example, a canvas gives each placement an explicit position and size.
We ran the example with Python 3.12, svglib 2.2.0, and ReportLab 4.4.9. Install the two pinned packages in your project environment:
python -m pip install "svglib==2.2.0" "reportlab==4.4.9"Save this small emblem as logo.svg. It contains three paths with solid fills and no linked images, fonts, or effects. It is hand-authored artwork for this demonstration, not a PerfectVector conversion result.
<svg xmlns="http://www.w3.org/2000/svg"
     width="240" height="120" viewBox="0 0 240 120">
  <path fill="#1c625e" d="M0 120 L60 0 L120 120 Z"/>
  <path fill="#e5a340" d="M96 120 L156 24 L216 120 Z"/>
  <path fill="#163451" d="M228 12 L240 12 L240 108 L228 108 Z"/>
</svg>
The SVG's viewBox describes its internal coordinate rectangle. The imported drawing's width and height tell you the dimensions you should use for PDF placement. Read them rather than assuming that an SVG pixel equals a PDF point.
For this file, svglib 2.2.0 returned 180 × 90 points. Its current units documentation maps a CSS pixel to 0.75 PDF points. Older examples may use different assumptions, so check dimensions when upgrading an existing pipeline.
Fit the logo without stretching it
Save the following as place_logo.py beside the SVG and run python place_logo.py. All page positions and box dimensions here are PDF points. There are 72 points in an inch; the default canvas origin is at the lower left, as described in ReportLab's canvas guide.
from reportlab.graphics import renderPDF
from reportlab.pdfgen import canvas
from svglib.svglib import svg2rlg


def draw_svg_in_box(pdf, drawing, x, y, box_w, box_h):
    if drawing.width <= 0 or drawing.height <= 0:
        raise ValueError("The SVG needs positive dimensions")
    factor = min(box_w / drawing.width, box_h / drawing.height)
    pdf.saveState()
    pdf.translate(x, y)
    pdf.scale(factor, factor)
    renderPDF.draw(drawing, pdf, 0, 0)
    pdf.restoreState()


drawing = svg2rlg("logo.svg")
if drawing is None:
    raise ValueError("SVG could not be loaded")

pdf = canvas.Canvas("logo.pdf", pagesize=(640, 360))
draw_svg_in_box(pdf, drawing, 40, 154, 144, 72)
draw_svg_in_box(pdf, drawing, 302, 126, 288, 144)
pdf.save()
min() chooses the limiting dimension, so the drawing fits inside the box. Using the same factor for X and Y preserves proportions. This function anchors the drawing at the box's lower-left corner; unused space stays above or to the right. Center it separately if your layout requires that.
The canvas transformation is temporary. restoreState() prevents the logo's scaling from changing later text or page elements, and the original drawing remains available for the second placement.
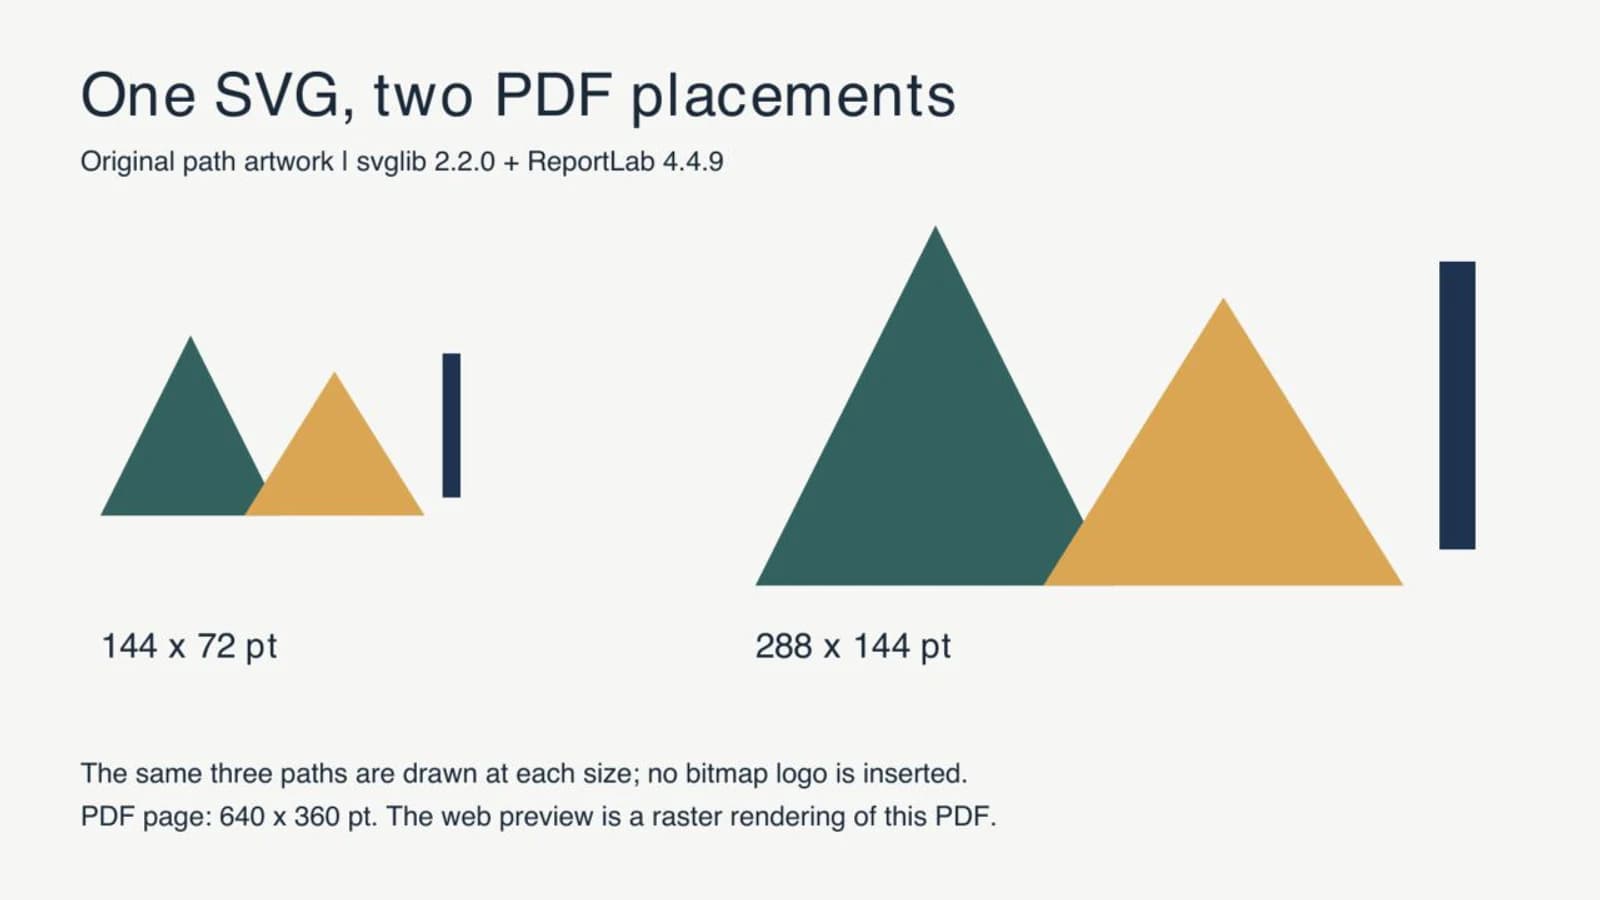
In the test, the two factors were 0.8 and 1.6, producing 144 × 72 pt and 288 × 144 pt artwork. The preview adds labels and a background to the same two placements so their sizes are easy to compare.
For a Platypus document, a drawing can join the story as a flowable. After scaling its contents with drawing.scale(factor, factor), update drawing.width and drawing.height by the same factor so layout uses the new footprint. Work from a fresh drawing when applying different sizes. The canvas example above avoids changing the drawing itself.
Check geometry and appearance separately
We inspected the test PDF's content stream with pypdf 6.10.0. It contained six path-start operations, corresponding to the three emblem paths drawn twice, and zero page images. We also rendered the entire page with Poppler and inspected the two emblems. The shapes, overlap, vertical bar, and proportions matched the intended placements.
Those observations apply to this simple fixture. Counting paths alone does not prove that every feature of another SVG rendered correctly. Likewise, zooming a PDF on screen cannot conclusively tell you whether it contains vector instructions or a large bitmap.
For your own document:
- Compare the finished PDF against the SVG in a browser or editor. Look for missing details, changed fills, clipping, and unexpected white areas.
- Check the emblem at the intended document size, where narrow gaps and fine strokes must remain readable.
- Inspect PDF image objects if the workflow requires vector artwork. Account for intentional photos elsewhere on the page.
- Keep the SVG master alongside the document-generation code. Recheck the PDF after changing the artwork or its rendering dependencies.
An SVG can itself contain a raster image. Reading that wrapper does not recover paths from its pixels. The embedded-image diagnosis helps distinguish a vector master from an SVG that still carries a bitmap.
Handle features the importer cannot reproduce
The current svglib limitations include unsupported masks and foreignObject elements, ignored stylesheet @import rules, and restrictions on CSS and clipping. A browser preview therefore cannot substitute for testing the PDF importer.
Keep a copy of the master before simplifying it. Where a logo depends on an unsupported effect, consider rebuilding that portion as ordinary geometry or using a different export route that you can verify. Retain the original raster when photographic appearance matters more than path editing. A flattened image can preserve appearance, but it changes the vector requirement.
For lettering, choose deliberately between document text and outlined artwork. Keeping words as text allows editing and search, but requires the intended font to be available in the document workflow. Outlining approved logo lettering preserves its shape while giving up normal text editing. Our path-only emblem does not test font handling; use a real sample of your type before relying on the same pipeline.
If you are assembling the document in a typesetting system instead of Python, the SVG in LaTeX workflow explains a separate graphics-and-label route.
Recover a raster-only logo before PDF placement
A legacy PNG on an invoice template is a reasonable candidate for vector recovery when the original logo file is missing. With PerfectVector's logo vectorizer, preview the raster artwork as SVG, inspect the contours and openings, and download a candidate for your document pipeline.
Check small lettering and borders before importing it. Redraw or retypeset elements that need exact typography, and remove unwanted background geometry in an editor. The logo vectorization guide covers that source-to-master decision in more detail.
Then run the actual ReportLab import and PDF checks above. A good trace still has to survive the importer and fit your document. PerfectVector supplies artwork paths; it does not choose ReportLab coordinates, register document fonts, or verify the resulting PDF. For charts, regenerate from the data and plotting source rather than tracing their labels or plotted values.
FAQ
Can I pass an SVG to ReportLab as an ordinary bitmap image? Use svglib to produce a Drawing and render it with renderPDF for this vector workflow. Converting the SVG to PNG first produces a raster insertion instead.
Why is my imported SVG smaller than an older example? The tested svglib 2.2.0 maps CSS pixels to PDF points at a factor of 0.75. Read the returned drawing dimensions and fit them to an explicit box instead of relying on older pixel-to-point assumptions.
Does this preserve every SVG effect? No. The importer has documented feature limits, including masks and foreignObject. Compare the exported PDF with the intended artwork, even when the script completes without an error.
Should I vectorize a screenshot of a chart? Regenerate a chart from its data and plotting source whenever possible. Reserve logo tracing for suitable decorative artwork whose editable original is missing.
Sources
- svglib — Package and units documentation — SVG-to-Drawing conversion, installation, and PDF-point sizing.
- ReportLab — Graphics — Drawing objects, PDF rendering, and use as Platypus flowables.
- ReportLab — Graphics and text with pdfgen — Canvas coordinates, points, and transformations.
- svglib — Known limitations — Import restrictions that require checking the finished PDF.
Keep the editable original when you have one. If only raster logo artwork remains, prepare an SVG logo candidate, inspect its paths, then place it at the required size and check the finished PDF.
More from the blog

jsPDF SVG: Keep Logo Paths in a Browser-Made PDF
Use svg2pdf.js with jsPDF to place an SVG logo, preserve supported paths, set its PDF size, and check the saved file against a rasterized export of that artwork.

EasyEDA SVG Logo Import: PCB Images or Panel Paths?
Import a logo into EasyEDA Standard or Pro without mixing PCB image tools with panel SVG paths. Check the editor, layer, size, and artwork before export.